
Folionomiq
Folionomiq measures an investment portfolio from its price history, so your AI can answer questions about it with figures it cannot compute on its own.
What it measures:
What you can ask
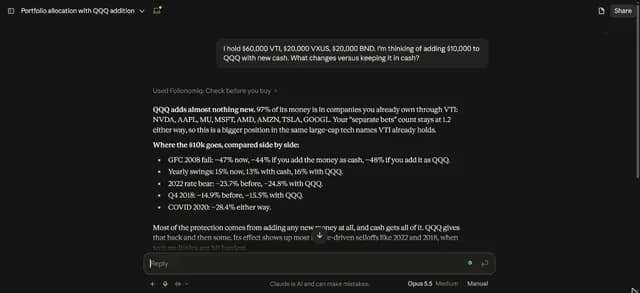
- Ask the assistant to measure a proposed change with `test_a_change` and report what it moves, without saying whether to make it.
Example path
MCP connector
- Server URL
https://folionomiq.com/mcp- Login
- None
- Protocol
- MCP 2026-07-28
- Instructions
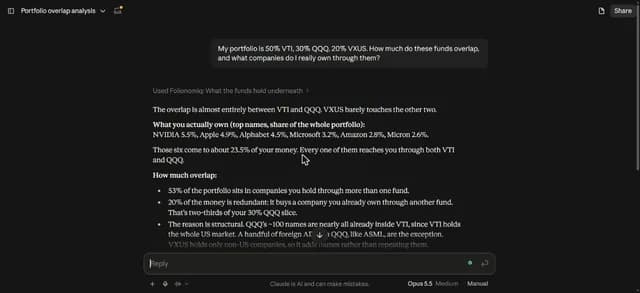
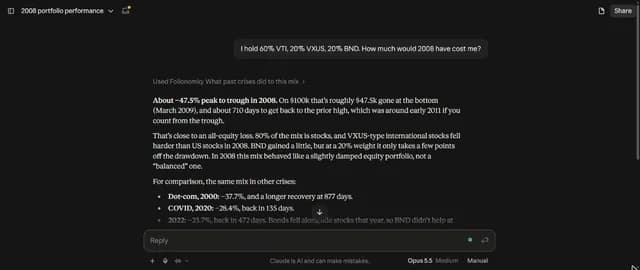
Measures an investment portfolio from its price history: how many independent bets it really holds, which holding carries the risk, what it owns through its funds, and what past crises did to that money. Descriptive only: no forecast, no buy/sell/hold advice, no score of how good a portfolio is. It fits any question that names tickers, a fund or a portfolio: its risk, what past crises did to it, overlap between funds, withdrawals in retirement, a monthly investing plan, or one ETF or stock on its own; the figures are measured on those exact holdings rather than recalled. takes the holdings as {ticker: weight or amount} and answers all of it in one call; and resolve a ticker that is uncertain. For one question (just the crises, just the funds' companies…), the narrower tools answer it with less.
Descriptive. No forecast, no advice. Every figure is measured over the window named beside it, from end-of-day prices. Nothing here predicts a price, a return or a probability, and nothing here says what to buy, sell or hold. A figure's limit is stated beside it, and a figure that is not in the result was not measured.
Tools
Reads data22
Skills
None in the store listings or on the server
Screenshots
 Binance#149